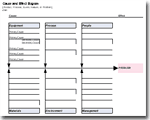
 This Fishbone Diagram, also known as a Cause and Effect Diagram or Ishikawa Diagram, was designed for ease of use. So, even though it isn't angled like most fishbone diagrams, it is much easier to edit than one that uses textboxes and arrows.
Fishbone Diagram Template
 This Fishbone Diagram, also known as a Cause and Effect Diagram or Ishikawa Diagram, was designed for ease of use. So, even though it isn't angled like most fishbone diagrams, it is much easier to edit than one that uses textboxes and arrows.
Annuity Calculator
 This new Annuity Calculator can help you figure out how much you need to have saved for retirement. The Savings Calculator can help you figure out how much you will have saved by making regular contributions for a number of years. Then, the Annuity Calculator can help you figure out how long that savings will last you.
MACRS Depreciation Calculator

This new Depreciation Calculator can be used for basic depreciation calculations including straight-line (SL), sum-of-years' digits (SYOD), and declining balance (DB) methods. It also includes a worksheet for calculating the MACRS depreciation using the approach outlined by the IRS.
Depreciation Schedule
 This new Depreciation Schedule template lets you list multiple assets and calculate total yearly depreciation. You can choose from straight-line or declining balance depreciation methods.
College Savings Calculator
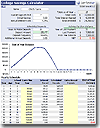
 This new College Savings Calculator helps you create an educational savings plan for your child. You can specify yearly costs for grades K-12 in additional to college costs. The monthly deposit amount is calculated based upon the costs, yearly deposits, and other deposits that you specify.
IRR and NPV Calculator
 This NPV Calculator will show you how to use the NPV, IRR, XNPV, and XIRR functions in Excel.
PICK Chart for Lean Six Sigma

This page explains how to use a PICK Chart in a Lean Six Sigma event to help categorize process improvement ideas. You can also download a free template for recording the ideas.
Subscribe to:
Posts (Atom)